


Advanced Explainable AI: An Update on Monolith’s Grant Work
This article is written by Joël Henry, our Principal Engineer here at Monolith:
We have started the grant more than a year ago now, so it feels like a good time to write more updates on the work we have done so far. As a reminder, the grant started in November 2021, and aims to develop explainable AI methods. The grant has a primary focus on the performance and manufacturability of components in the automotive industry, although some of the technology produced will be reusable for other applications. The work done was also mainly focused on methods applicable to 3D models - that is, AI models using the 3D geometry of a component as an input. Such methods are already widely used for tabular models (e.g. sensitivity analysis), and creating similar methods for 3D models seemed a natural next step for the Monolith platform.
The first thing to mention is how well the collaboration with Imperial College London (ICL) went. Dr. Nan Li and her team have done a great job, creating some data sets and AI models that we have been able to further use to apply explainable methods. We really appreciated how they were able to quickly generate a simple data set to enable us to get started with the research, and how they then created a much more complex and realistic data set to better represent data coming from the industry. It was also great to be able to visit them and their labs at the end of last year (see Figure 1). They have already presented their work at https://www.galm-usa.com last August and at http://www.icmim.org this January, and I know they would be happy to share their finding with anyone interested (see for example some results of one of their models trained on a stamping data set in Figure 2).
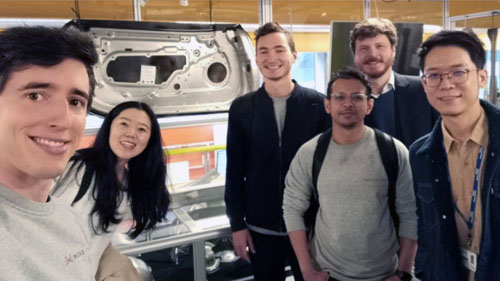 Figure 1: Monolith team visiting ICL team and their stamping lab.
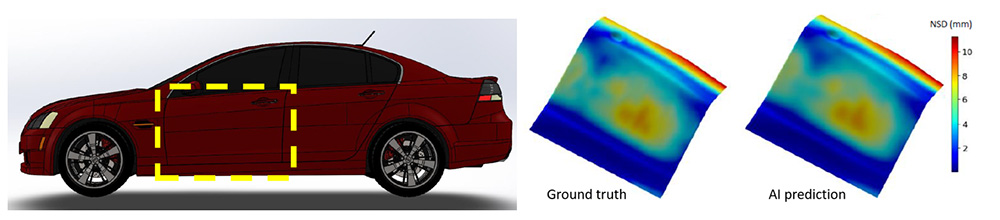 Figure 2: Left: Door panel was the component selected to create one of the data sets by ICL. Right: ICL AI models predicting springback displacement field of stamped door panels showed great accuracy when compared to ground truth.
The grant couldn’t have progressed much without our industrial partners and current clients, with whom we iterated over the different ideas we had. It was hugely encouraging to see the enthusiasm for the different explainable methods we explored and hear them explain what value they see and how they would use them day to day. We even found new ideas we hadn’t thought about before. It was also helpful to hear their comments on our suggestions, and their feedback really helped us to prioritise our work to deliver the greatest possible value to them.
Update on Our Work At Monolith
Now, it’s time to give some updates on the first year of the grant. The initial focus was to do some research on existing methods, as well as collect a first round of feedback from partners and customers on what explainable methods would be most valuable to them. There were some challenges in translating some of the existing methods to 3D. For example, some inspirations from image application didn’t lend themselves well to 3D (you can remove parts of a picture to identify which part is responsible for having a giraffe in that picture (see example further down), but it’s harder to remove the doors of a car to understand their impact on the drag of a vehicle). However, we still identified multiple ways to leverage AI models to enhance understanding.
Among the different methods researched, we started working on a way to generate user-defined 3D shapes. Users can select a small group of 3D designs that share a specificity, and the algorithm will then be able to produce geometries that present more or less of that specificity. Figure 3 shows some applications of this concept to the “boxiness” and “sportiness” of a car (left) and the height of a component (right), but users could for example select designs that are lighter, easier to manufacture, cheaper to manufacture, and then could see how this specificity would impact the component performance, like drag, strength, etc. The work was presented at a CVPR2022 conference last June, and the full paper is available here.
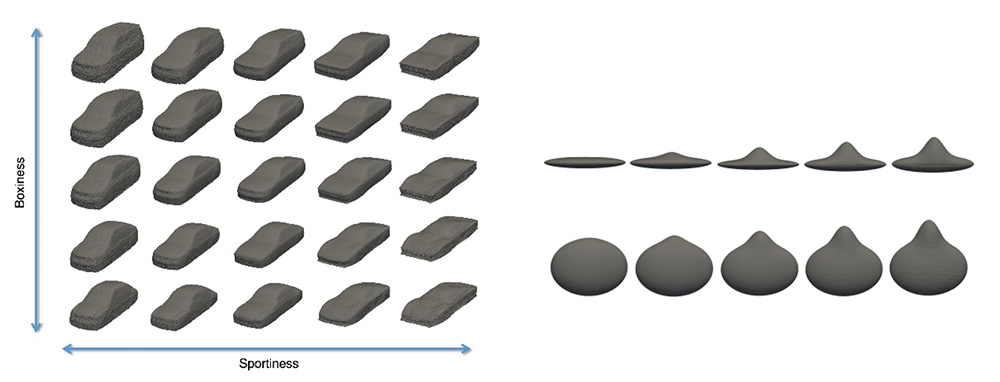 Figure 3: User-defined parameters enable users to create and modify 3D geometries according to a specificity defined by the user. Left: Effect of changing the boxiness and sportiness of a car. Right: Effect of changing the height of an ellipsoid body.
The next large piece of work we did was to create heat maps that would highlight the contribution of each part of a design towards a specific output of that design (performance, cost, …). Let’s illustrate the concept with the left part of Figure 4. An AI model was able to identify the picture on the left as a giraffe. An explainable method selected sub-parts of the image, and each time looked at the probability of that section being a giraffe. Combining all these results together, the method returns a heat map indicating which region is contributing the most to predicting that it is a picture of a giraffe. A similar concept was used with 3D data, and the right part of Figure 4 shows a heat map highlighting regions contributing the most to some aero performances (lift, drag…). Although only one map is shown here, multiple types of maps with slightly different interpretations were created (point contribution, sensitivity, sensitivity in a normal direction, sensitivity compared to an average design, …). The main value of this method is that it can help a user focus on regions of interest when trying to improve a design further.
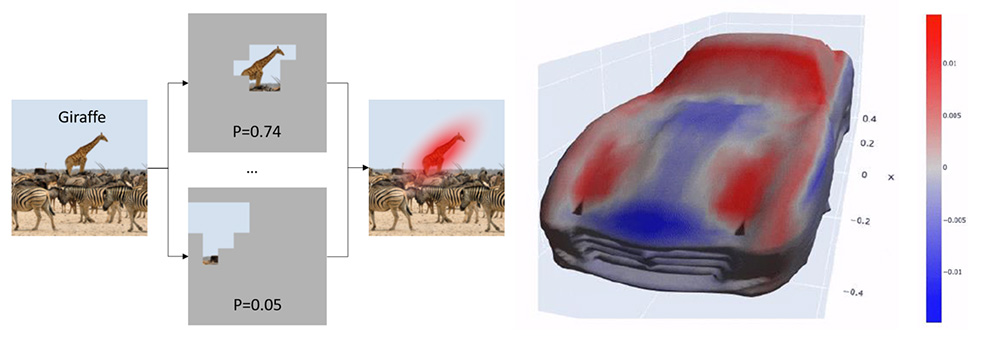 Figure 4: Left: illustration of the heat map concept with an image-based example. Right: application of the heat map concept to the aero performance of a car.
Following the heat maps, the next step was to use the results of the heat maps to optimise a design by automatically changing it to reach some desired properties. Based on the heat map results, each point of the design can be slightly and incrementally moved to get closer to an objective (e.g. reducing drag). Additional considerations were implemented to be able to control the smoothness of the created designs.
Next Steps for Monolith
The next challenge was to prioritise all the ideas we had. This was done considering multiple criteria, including obviously the value to our customers, but also the feasibility, the effort required, the alignment to our roadmap, etc. As a result, some ideas didn’t go beyond the literature review, some reached a proof of concept, some a prototype phase, and some are now being integrated into the Monolith platform. One benefit of this project is that some of the technology developed during the implementation phase will be reused to benefit other parts of the platform. For instance, improved user interaction with 3D geometries is an outcome of the project that will be reused elsewhere in the platform.

The next phase of the project now is to test the different methods with our partners and customers. We want to make sure that the work we did is valuable, but also usable. If you’re interested, there’s still time to join us, just get in touch!