

In the complex world of engineering and product testing, the ability to quickly identify and address anomalies in test data is crucial. Anomaly detection tools can flag measurements that are significantly different from their expected values, suggesting potential errors, faults, or extraordinary new findings.
They are particularly relevant in fields involving large datasets (often time series), such as financial transactions, network security, healthcare monitoring, and engineering tests.
There are a lot of different approaches to detecting anomalies. At their core, most options consist in predicting expected values and comparing them to the true value. This includes reconstruction, distance-based, trees, forecasting, distribution-based or encoding methods.
Although they differ in how the expected values are predicted, they will often use the error (or difference) with the true value to identify what is anomalous.
.png?width=583&height=264&name=image%20(13).png)
Different anomaly detection methods are available in the literature (Schmidl et al. 2022)
However, methods will deviate again once the prediction error is collected. For some applications, this might be enough, but we found that further processing of this deviation was required to obtain a more meaningful score, that we simply called the “anomaly score”.
This article will explain the need for such a score on top of the simple deviation, how it is calculated and give an illustration of its impact.

Why do we need an anomaly score?
The issue with using the deviation between the prediction and the ground truth as a final metric is that it is often not clear when the deviation is normal/acceptable, and when it’s anomalous and should be flagged. There are multiple reasons for it.
First, different channels evaluated will have different scales, meaning that a difference of 10 might be small for one channel but large for another. There is a need to normalise this deviation by channel to have a more meaningful metric.
However, this normalisation is not enough. Indeed, even within a single channel, it is possible that the same amount of deviation will be anomalous in some conditions, but normal in others. For example, if you are dealing with noisy data, a certain error will be acceptable as attributed to noise in the data collection process.

However, if a similar error value is observed as part of a slow drift of the measured value, this should be highlighted as an anomaly. And this can’t be done by solely relying on the prediction error at each point.
As a result, using the reconstruction error as the only flagging mechanism will have limitations. The user might have to still go through large amount of data with high error, to manually identify whether they really are anomalies.
Even more critically, they might miss smaller errors that are reflecting anomalous behaviour in the signal.
What is the anomaly score and how is it calculated?
The anomaly score is a refinement of the initial difference, taking multiple additional factors into account, including:
- The type of anomalies that are occurring. Are we trying to detect local spikes, sensor dropouts, progressive drifts, all of them?
- The context around the time step. Is this point abnormally high compared to its close neighbours, to its more distant neighbours, to the entire test?
- The quality of the nominal (training) data. Was the data used for training noise, or highly contaminated with unlabelled anomalies?
- The desired sensitivity of the detector. What is the user’s appetite for risk? Do they want a conservative detector, making sure that all anomalies are found, even if that means more false positives (false alarms)?
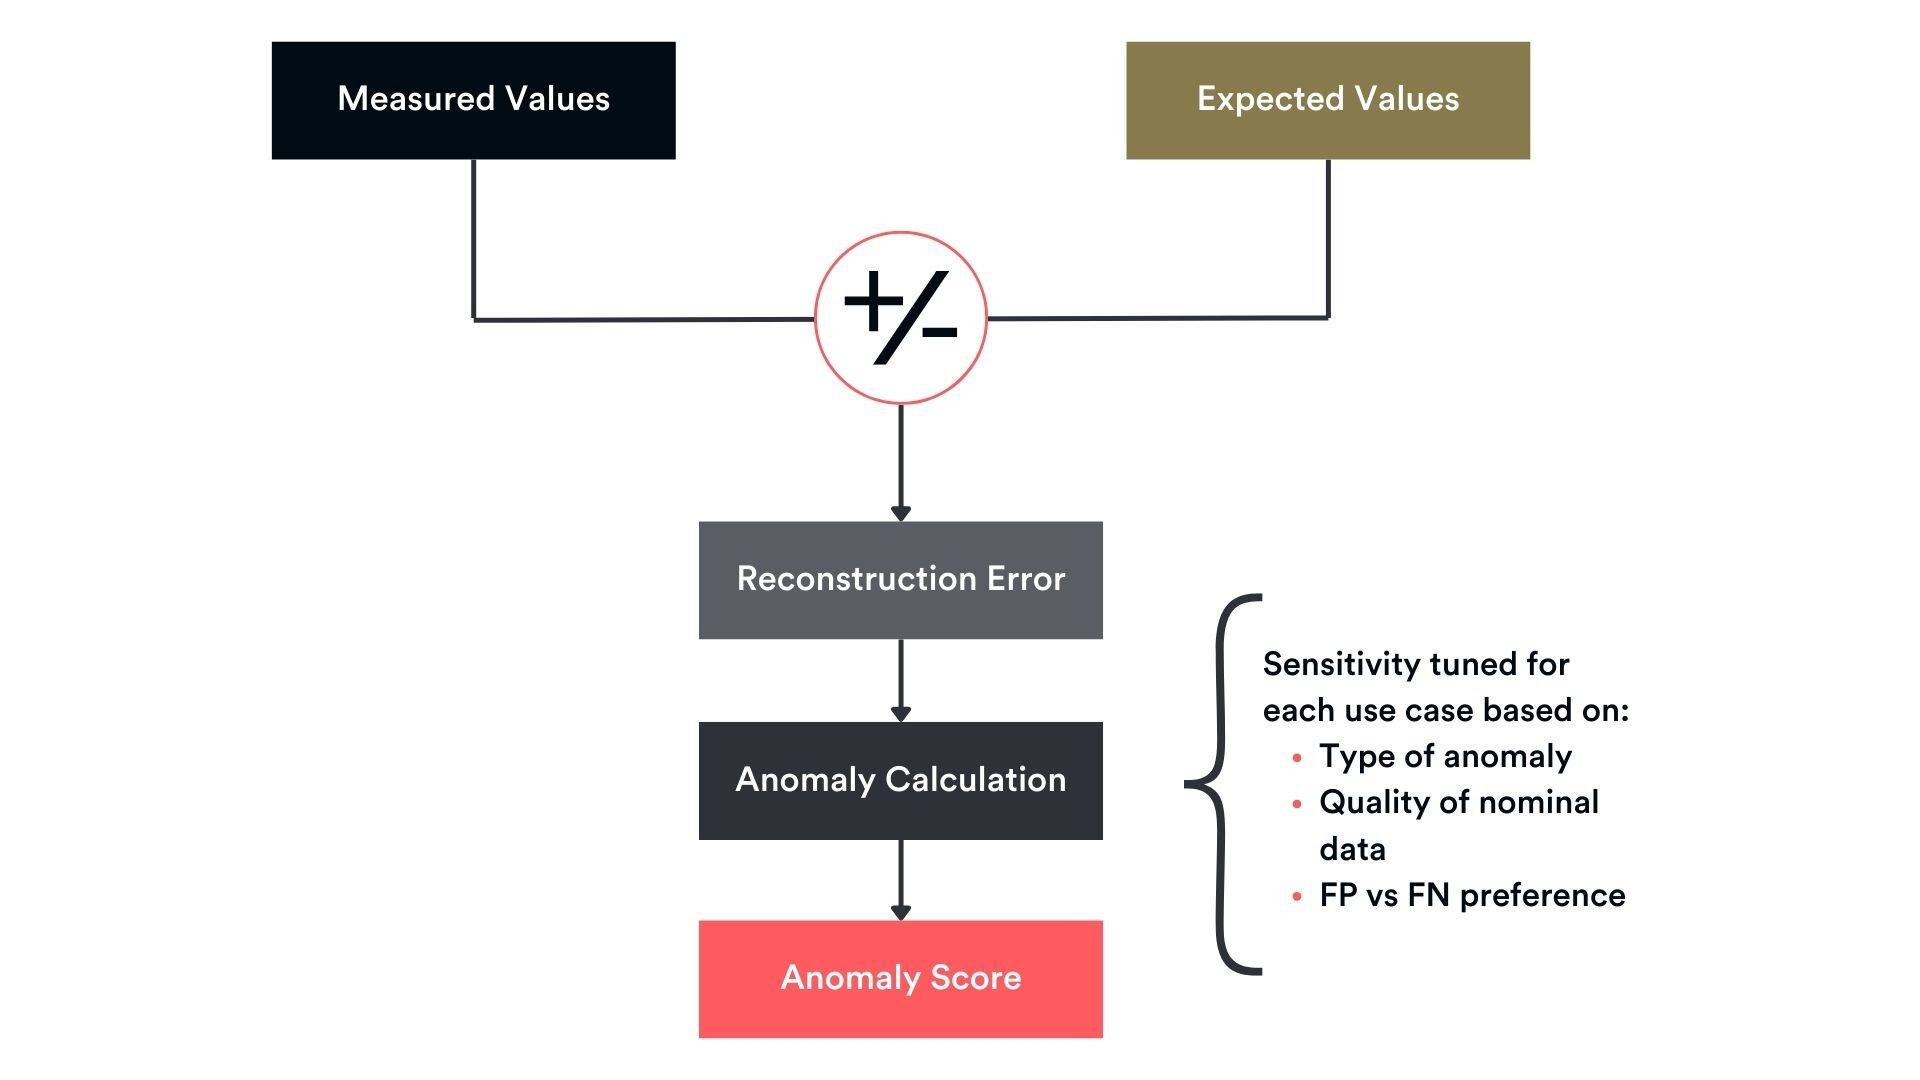
Illustration of the impact of using an anomaly score
In this example, the Monolith anomaly detector is looking for anomalies in track test manoeuvres.
The figure below shows a manoeuvre highlighted as anomalous. On the plot, we can see the measured signal from a channel (blue), the expected signal (green), and the anomaly score (red).
In both situations A and B, the reconstruction error is the same (see ranges shown by dotted white arrows). However:
- In situation A, the error seems to be due to some variation in the measurement that is not fully captured by the detector, but still expected and accepted. Despite the relatively high error, this time step is attributed a low anomaly score (around 0.25) and will be considered “normal”.
- In situation B, the error comes from a drift of the measurement compared to what is expected. As a result, this time, the same error value is attributed a much larger score (around 0.90) and will be flagged as anomalous to the user.
%201.png?width=2975&height=1089&name=image%20(12)%201.png)
The same reconstruction error can lead to different anomaly scores.
Conclusion
Anomaly scores are an important component of anomaly detection systems, providing a straightforward and meaningful metric to assess the normalcy of data. For test engineers, understanding, tuning, and utilising these scores is crucial for optimising the reliability and efficiency of testing processes.
Engineers face the daunting challenge of navigating vast datasets, where minor discrepancies can lead to significant, costly errors.
Against this backdrop, our mission gains critical importance: providing engineers with advanced tools that ensure rapid identification and correction of data inaccuracies, thereby safeguarding the foundation of machine learning models.
If you want to learn more about building and evaluating anomaly detection models, you may enjoy this blog on how to evaluate an anomaly detection model?