


How JOTA Sport is using intelligent data-driven algorithms to reduce testing times by 80%
In this article, we will explore how JOTA Sport uses Monolith to build self-learning models from their test data, in particular polynomial models and surface predictions, that enable them to reduce test campaigns by almost 80%, while obtaining similar performance map accuracy!
Data-driven approach: JOTA Sport racing
Using Monolith, JOTA is overcoming the tedious, time-intensive, and repetitive engineering approach that they previously utilised during testing.
Rather than trying to hard-code all of the equations and making sure to embed all the physics of a given system, JOTA instead feeds the self-learning model using real-world test data to learn from real-world performance, which can be taken from track or wind tunnel testing.
Using self-learning models is the best way to infer the physics, quickly understand, and instantly predict what design parameters are affecting vehicle performance.
“Monolith has already radically changed how we operate. Their software streamlines how our car and simulation data is validated.”
Tomoki Takahashi (Technical Director at JOTA Sport)
Racing testing data: accurate results and predictions through data-driven analysis
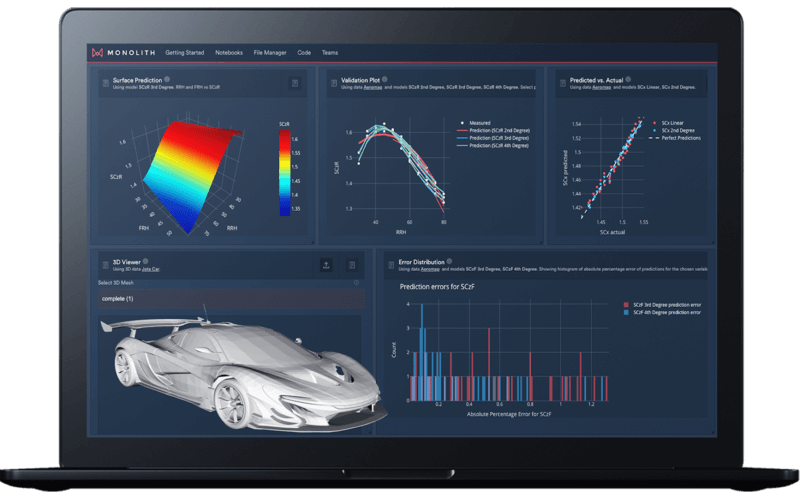
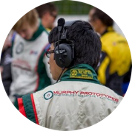
In this data-driven approach example, we import a testing data sample from one lap that carries a surplus of information and data which is not all needed for further processing.
The example pictured below has four dimensions including the front ride height and rear ride height, which are the distances between the car chassis and the ground, and front (aFlapF) and rear (aFlapR) adjustable elements.
Typically, this can be a wing, adjustable splitter or simply any form of adjustable drive plane and aerodynamic device. As a function of these four inputs, the engineer has an idea of the generated downforce on the front wheels (SCLf), downforce on the rear wheels (SCLr), and drag coefficient (SCd).
Monolith dashboard showing imported data of a 4-dimensional aero map
Data-driven polynomial regression & aero map
The most simplistic model that can be employed is a polynomial model. This model is simple in the sense that it is fitting a fairly simple polynomial function to the data.
In general, teams use much more complicated approaches to solve these intractable problems.
Typically, the simplest way to input these aero maps into these tools is a polynomial model, which defines where we are going to start.
There are other advantages to polynomial models in this context such as their interpretability, adaptability, and ease of integration into fuller model-based systems engineering (MBSE) programs, such as lap time simulations.
At the same time, aerodynamic data is notoriously noisy and so often having the perfect fit to the point that you have is actually not desired.
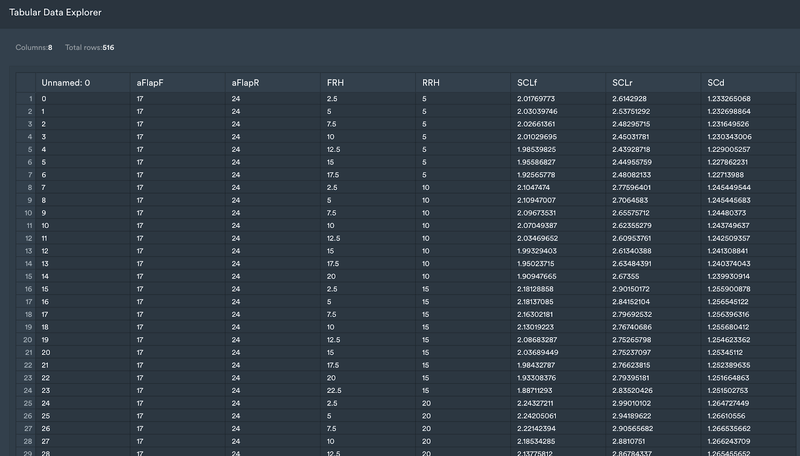
Initially, we ran second, third, and fourth-order polynomial models for predicting front downforce based on front flap, rear flap, and rear ride height.
Polynomial models with the corresponding parameters and polynomial coefficients - the length and complexity of the derived equation increases with the order of the polynomial.
The output is the parameters for each of the runs as well as the polynomial coefficients for each of these options that users can then easily have a look at performance metrics to compare the fit.
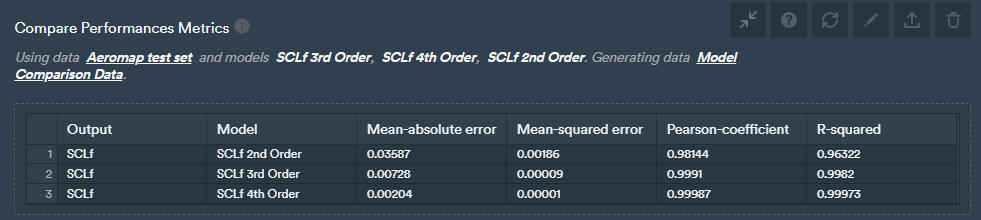
Data-driven aero map test data performance metric comparison.
What can be observed is that there's clearly a step forward that's taken between second and third-order in terms of relevant performance metrics, and lesser between third and fourth-order. In terms of all the metrics that we're looking at, we can also generate a plot that shows the predictive versus actual values.
This means you give the model a set of test data, and you have the actual front downforce on the x-axis and the predicted on the y-axis, and ideally, they should be as close to the dashed line as possible, indicating that the predicted value matches with actual values.
This is a great way to visualise and compare the quality of models. As you can see below, clearly the second order is more scattered and the fourth-order model is more tightly around the dashed line predicting the values more accurately than the second-order model.

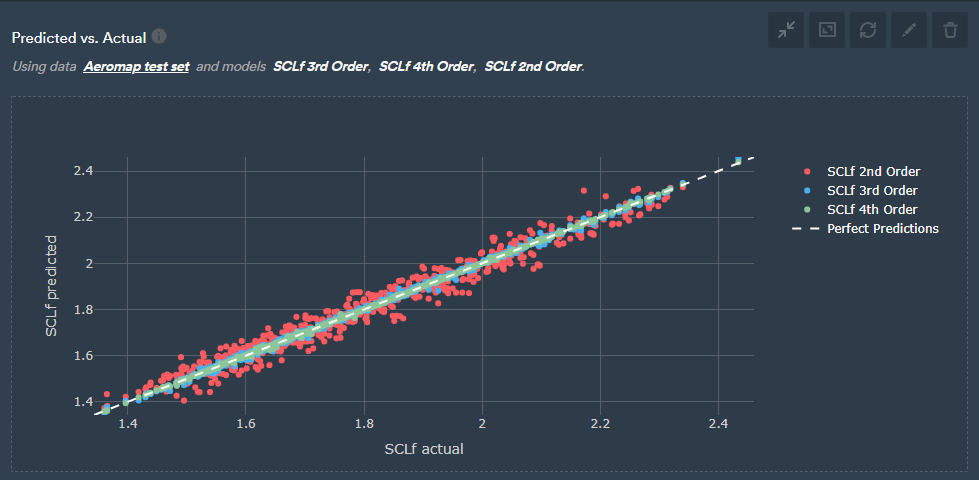
Predicted vs. actual values for second, third, and fourth-order polynomial models.
Comparing against criteria
Another interesting plot to look at is comparing against criteria which effectively tells engineers what percentage of data is within a certain percentage error.
For example, the figure below shows that most data will be predicted with an error smaller than 6% for the 2nd-order polynomial, and with an error smaller than 2% and 1% for the 3rd and 4th-order polynomials respectively.
This confirms the results from the metrics above that suggested that 3rd and 4th order polynomials were much better than the 2nd order ones.
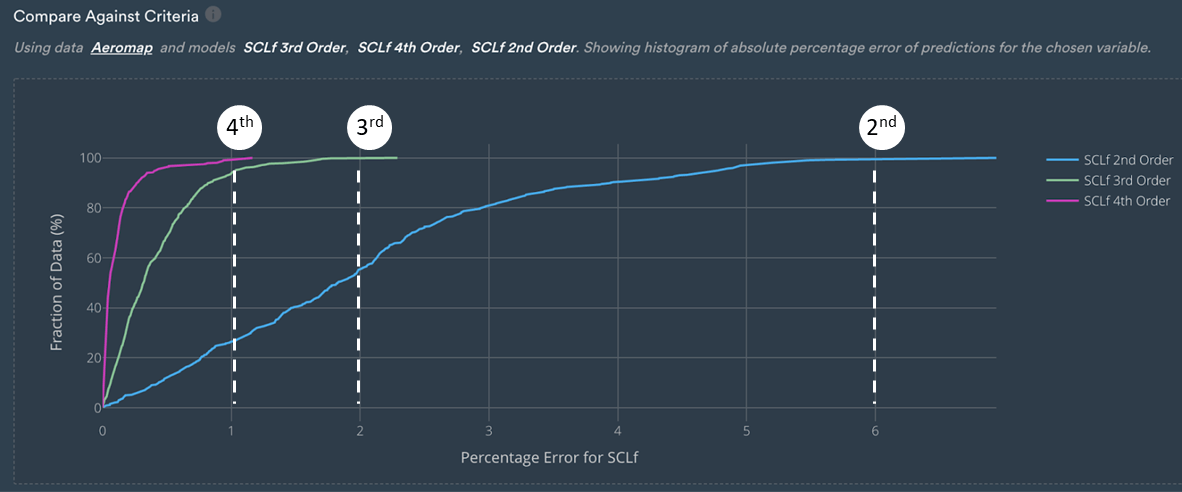
Percentage of error for SCLf against the fraction of data used [%].
Model-based data predictions: making data-driven curve predictions
Another interesting aspect to note is the actual shape of the curves that have been predicted. The second-order front ride curve is effectively a straight line.
With the given input parameters, users can vary their view by using the dragging sliders to see different curve predictions for a different set of parameters and see the change in real time.
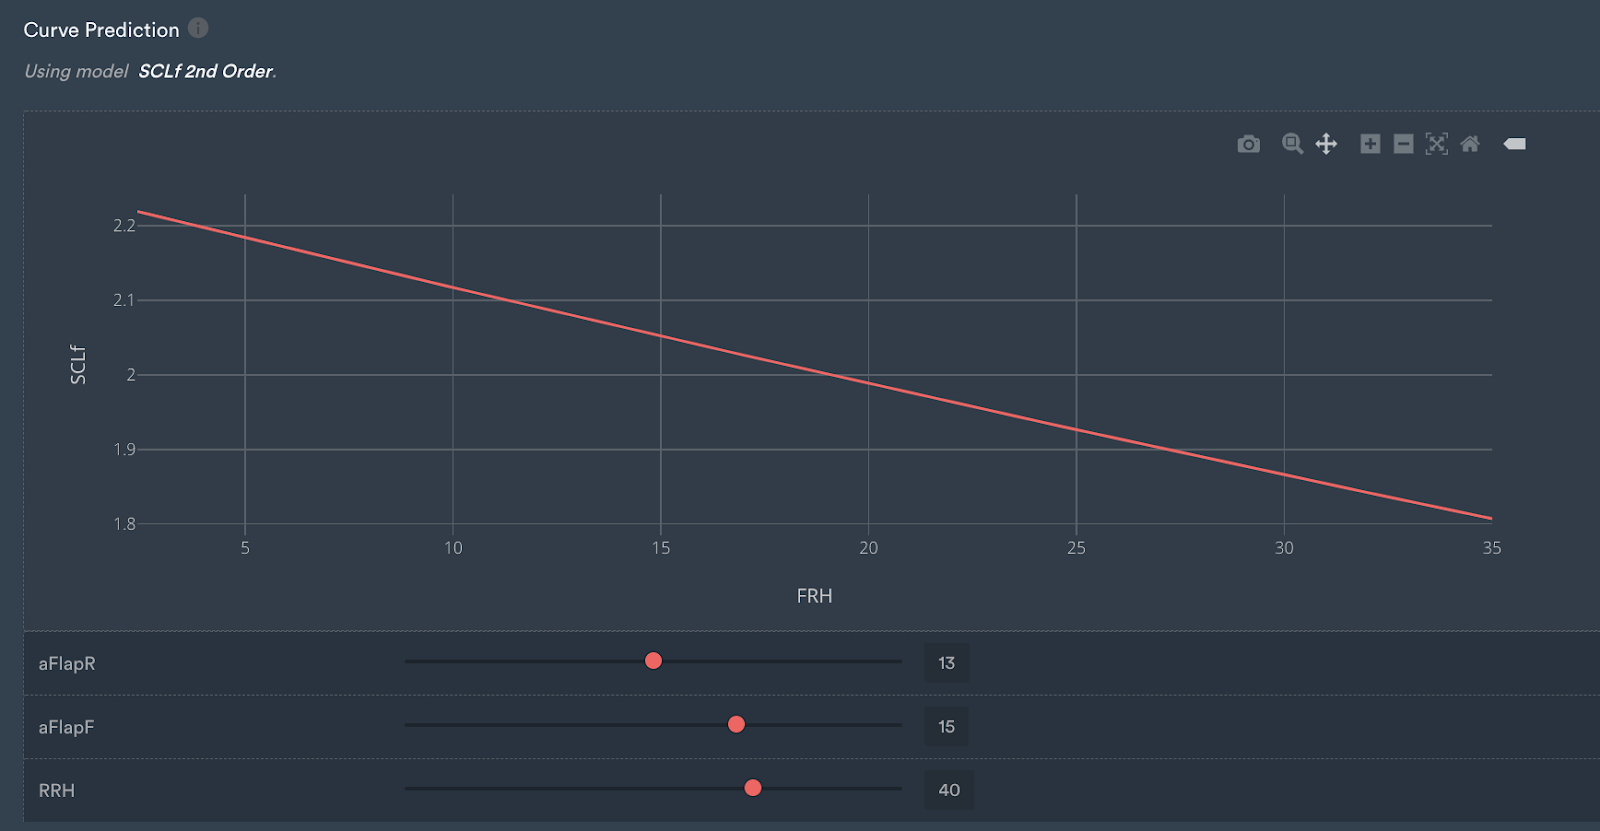
Curve prediction for the second-order model.
The third-order curve and the fourth-order curve don't differ significantly, which was expected as both models had similar performances according to the metrics and plots above.
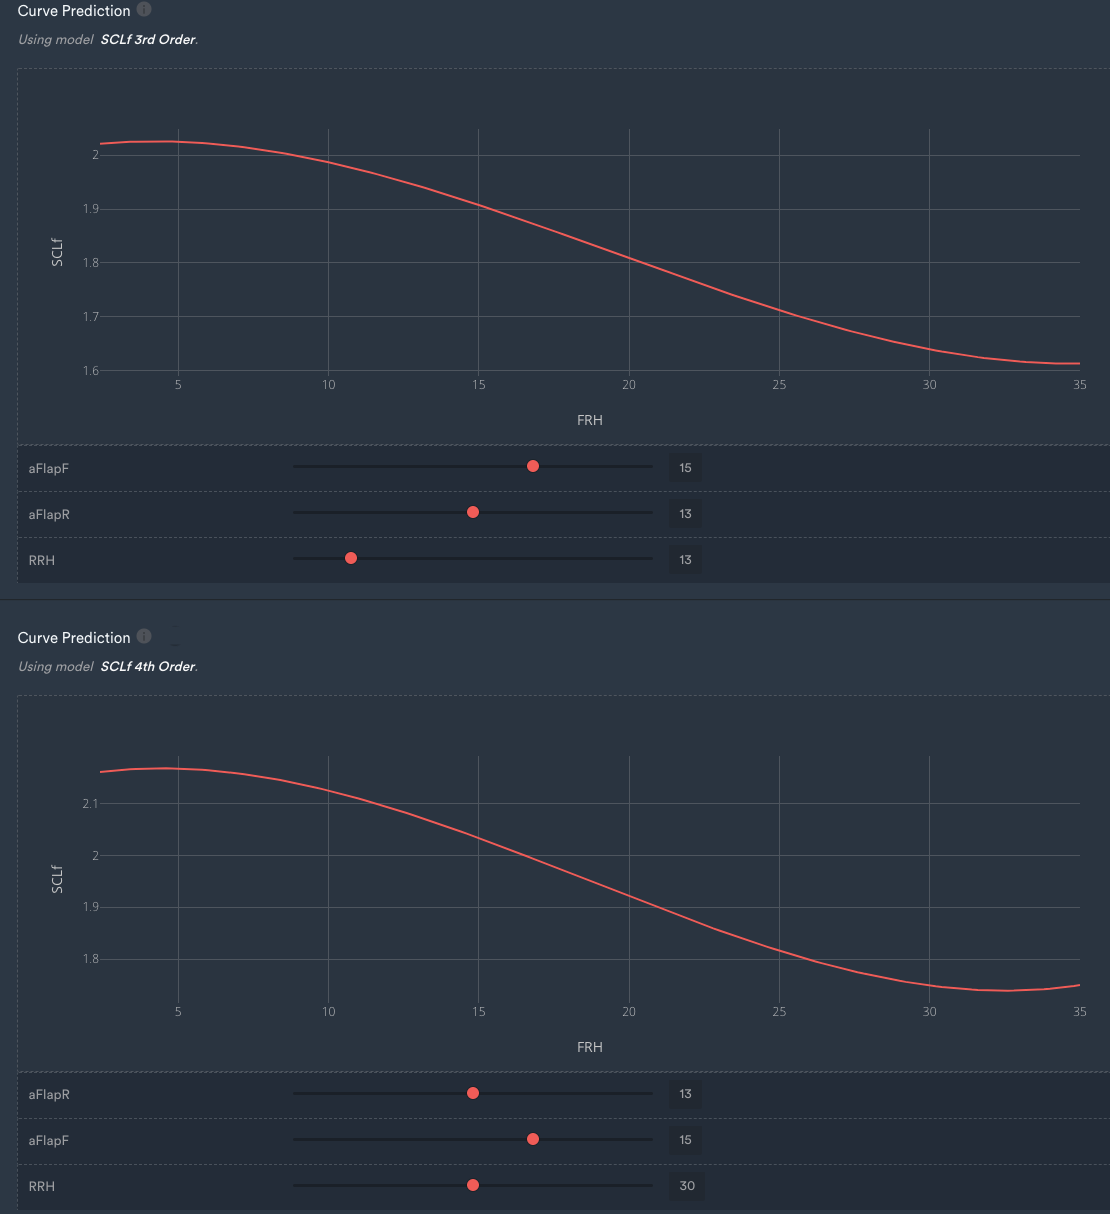
Curve prediction for the third and fourth-order model.
Making data-driven surface predictions
We are working with a four-dimensional model, so it makes sense to look at the effect of multiple dimensions.
Surface predictions in 3D are a great tool to do so.
The third-order polynomial has a shape that is sensible, and the only place where it is less representative is at very high rear ride heights and very high front ride heights.
However, these areas of the map are not covered by the car frequently. In the range of performance that JOTA is expecting to use their vehicle, the surface seems well-behaved.
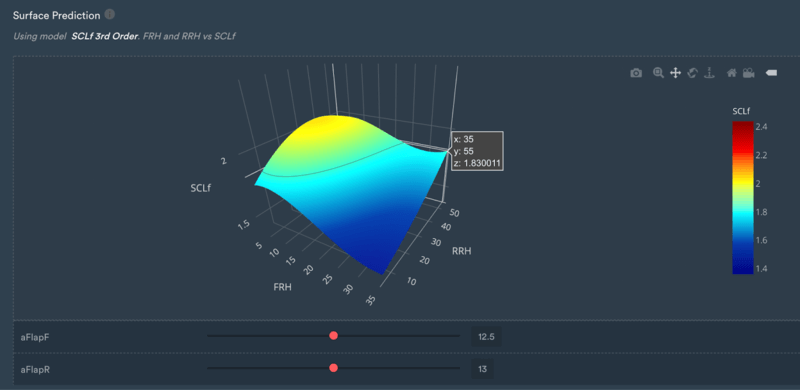
3D Surface prediction for the third-order model.
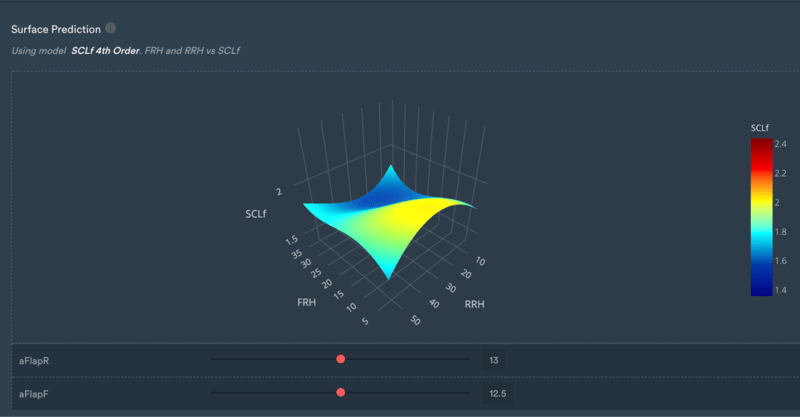
If we have a look at the fourth-order map, we can see that it's not behaving as expected at the edges.
It is starting to lift in regions where theory dictates it should decrease, which again suggests that it may be overfitting or due to the fact that polynomial models can be quite bad at extrapolating at higher orders.
The edges of the surface prediction are regions that are not mapped in the model, will give you unphysical results, and are very unlikely to happen in a real racing scenario.
It's clear that the third-order solution is the best choice in this example, given that it's a very strong fit and it behaves sensibly in areas with not necessarily much data to train on!
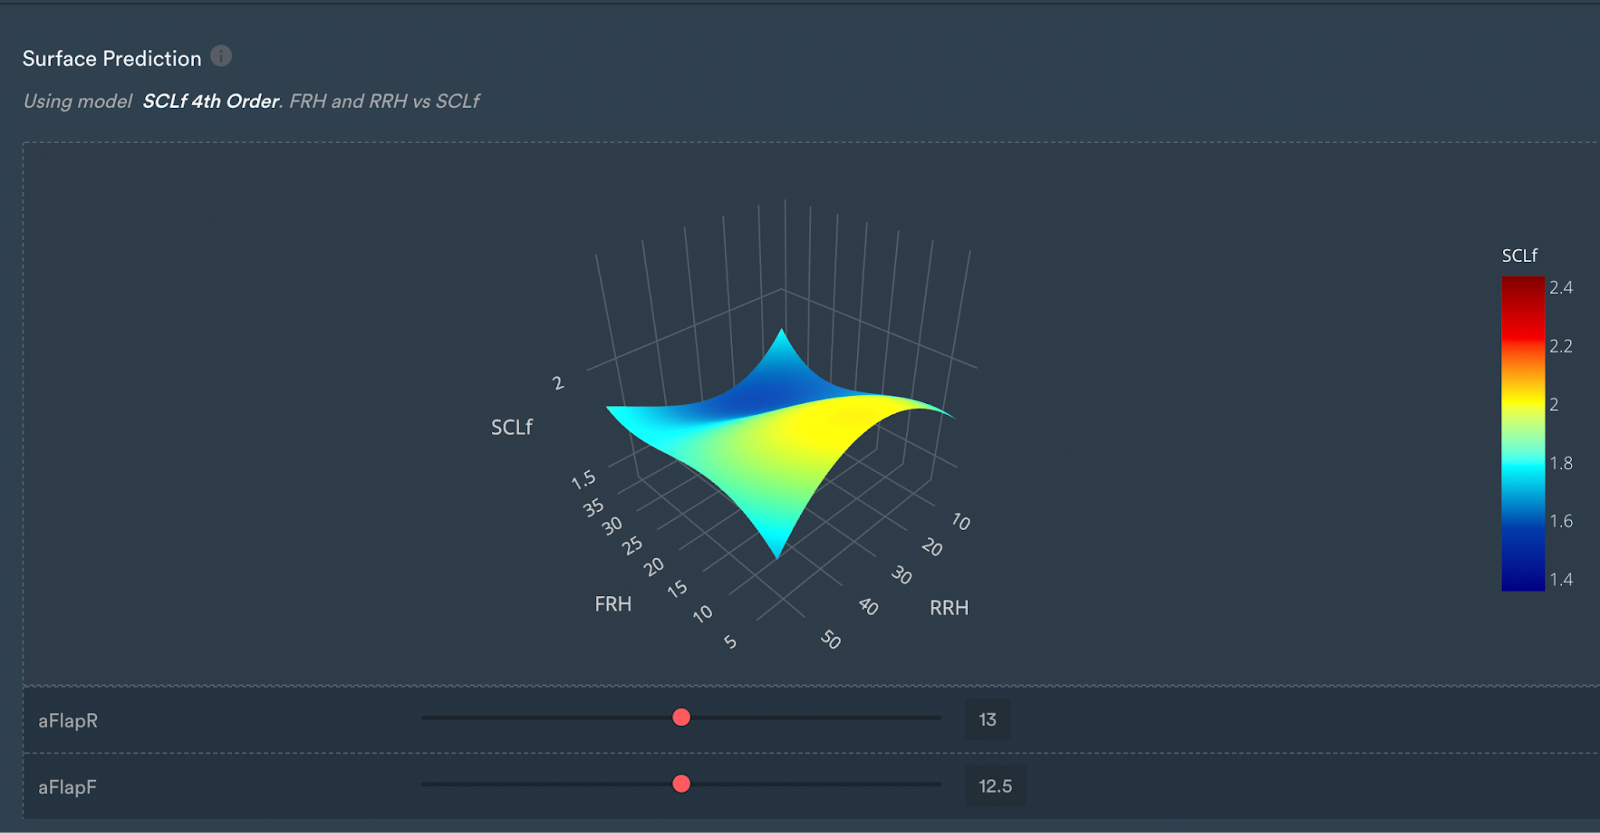
3D surface prediction for the fourth-order model.
You can also look at using this method of how, for instance, the front aerodynamic device slope varies with front ride height and the dependency of these parameters.
Drag is less of a problematic parameter to fit because it mostly depends on the rear wing angle which is the overwhelming factor.
All of the other inputs don't really have as much of an effect which can easily be verified using Monolith’s sensitivity analysis functionality.
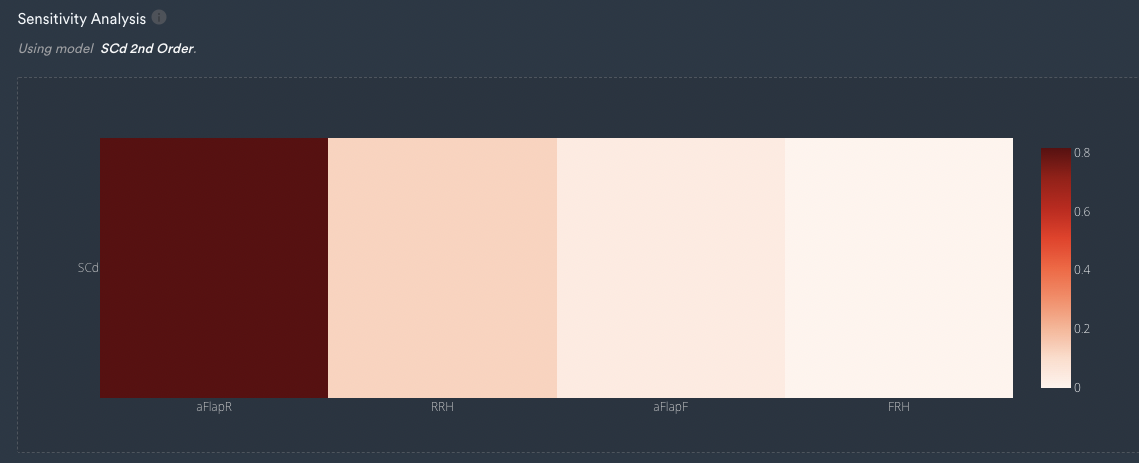
A sensitivity analysis inside of Monolith indicates that the drag is predominantly governed by aFlapR and nearly not impacted by the other inputs.
Day-to-day use of data-driven self-learning models
Drivers generally care a lot about drag because they can feel drag slowing them down on the straights, whereas aerodynamicists care a lot more about downforce because that's ultimately where the lap time is.
Obviously, there's a compromise between the two, which must be optimised for the characteristics of each track JOTA visits across the season.
With Monolith, engineers can use track data to learn the car behaviour and predict an optimal car configuration for each track.
Once models have been trained and validated, they are then used daily by the team to quickly predict the behaviour of the car in different conditions.
To learn more on how these models are used by JOTA engineers to better understand and predict the aerodynamics of their cars by building self-learning models and reducing the number of simulations and tests, check out the success story below.
Data-driven approach for accurate testing
Monolith supports customers like JOTA Sport to improve their race car performance in a number of data-driven ways.
Some challenges that JOTA solves with Monolith include intractable physical problems such as tyre degradation, suspension modelling, and incorporating different weather conditions and drivers as well as tracks.
Examples of applications where Monolith supports JOTA Sport with a data-driven approach
Using self-learning models to fit their entire data set, JOTA can achieve a high degree of fidelity, especially in the aforementioned topics, to quickly understand and instantly predict the intractable physical problems they encounter.
Monolith empowers JOTA engineers to optimise their test cycles, predict results, and understand relationships and sensitivities between input parameters and their component/product performance, leveraging their test data in the most efficient data-driven way possible and reducing testing times by up to 80%.